Measuring L&D’s Success: What Reports Matter Most to Organisations?
)
Learning analytics supports learning and development in many ways. So how do organisations use analytics today? And how do they want to apply it in an ideal world?
This article explores findings from two L&D surveys, which gauge how learning analytics is currently being used, and the metrics that sit behind measurement efforts. We consider the perpetual dilemma—does your organisation measure the type of learning outcomes that demonstrate business impact?
We examine the resulting insights from more than 1,000 L&D professionals:
- Measuring the Business Impact of Learning (2023). Since 2016, Watershed has partnered with LEO Learning to conduct the annual Measuring the Business Impact of Learning (MBIL) survey.
- Adopting Learning Analytics: Closing the C-Suite/L&D Language Gap. Watershed teamed up with Chief Learning Officer magazine to survey its readers (CLO) on topics relating to L&D and learning analytics.
How organisations measure L&D success vs. How L&D measures its success
In conducting these surveys, we were curious to see exactly what organisations measure. And with so much data now available across the learning ecosystem, we can broadly split measurements into three main areas:
- L&D productivity (net new content production)
- Learner experience (productivity and satisfaction, such as number of courses completed and happy sheets)
- Business impact
L&D productivity and learner experience have been entrenched as corporate L&D’s measure for success for many years. However, A Shiny Apple Is Not a Tasty Apple: L&D's Success Metrics Are Wrong. The highest-performing learning organisations often build on these points to correlate the outcomes from their learning with tangible impact on business daily life.
It’s important to recognise that a blend of the three core groupings is needed to build a rounded outlook of how L&D performs as a function, and then the impact it is actually having on the organisation as a whole.
But do the measures commonly progress as far as business impact? Our findings suggest not. While 99% of those surveyed want to measure the business impact of learning programmes, the majority also rated themselves on the lower end of the learning analytics maturity model (either at basic measurement or data analysis).
Survey results paint a mixed picture of how organisations measure L&D; however, there is a clear tendency toward learning experience analytics, which centres around content and learning experiences rather than the person and improvements in their performance. For instance, the Measuring the Business Impact of Learning 2023 (MBIL) survey results asked how success was measured. Here are the answers:
- 16% - We're not evaluated
- 14% - Content utilisation
- 27% - Learner satisfaction
- 11% - Return on investment
- 19% - Organisational impact
- 14% - Improvements in job performance
This shows us that 41% of respondents measure L&D departments using metrics relating to the learning experience—such as content utilisation (14%) and learner satisfaction (27%). Digging into this further, we also asked how metrics were set, factoring in a blend of metric types being used:
- 18% - L&D consults with the wider business so success can be correlated with impact (e.g. increase in sales)
- 31% - L&D sets the metrics (KPIs focus on programme effectiveness such as completion rates and learner satisfaction
- 51% - A blend of both
When we looked at the breakdown of the data in even more detail, we saw that more advanced organisations (those considered to be ‘strategic partners’), were almost three times more likely to use business impact metrics than those who are considered a ‘shared service’ (see page 9 of the MBIL 2023 report).
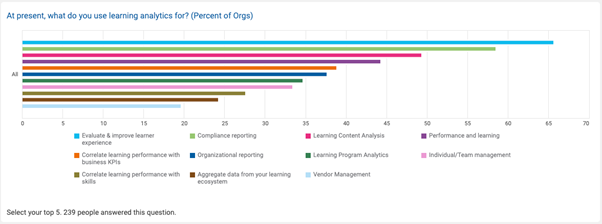
What is L&D evaluating using learning analytics?
The CLO survey results show that L&D departments use analytics to evaluate learners, content, and programmes. Specifically:
- 66% to evaluate and improve learner experiences.
- 59% for compliance reporting.
- 50% for learning content analytics.
L&D teams were less likely to use analytics relating to performance:
- 44% for performance and learning.
- 39% for correlating learning performance with business KPIs.
- 28% for correlating learning performance with skills.
And last, teams were least likely to use learning analytics on learners:
- 38% for organisational reporting.
- 35% for learning programmes.
- 34% for individual/team management.
Compliance: Mandatory reporting remains a business essential
Compliance reporting was the second most-selected option for using learning analytics, with 59% of survey respondents listing it in their top 5. However, when asked how they would like to use learning analytics in an ideal world, only 38% included compliance—the second least-selected option.
This was the case even though they could have selected every applicable option. In fact, compliance reporting was the only type of learning analytics where the percentage of organisations selecting this option decreased from current to ideal usage.
Does this imply that organisations want to move away from compliance reporting with their learning analytics? A finer nuance may be that there is more desire to increase analytics’ capability in other areas.
Compliance reporting is not going away—regulators and managers still need to know that people have completed the required training. The good news is that the same learning analytics platforms that you might implement to measure performance can also help you report on compliance more efficiently.
Such platforms can combine compliance data with HR information to create compliance dashboards that automatically update. As a result, managers are empowered to keep track of their teams, while senior leaders and stakeholders have an overall view of organisational compliance.
We want to measure performance. But we don’t.
Less than half of the respondents said they use learning analytics for performance reporting.
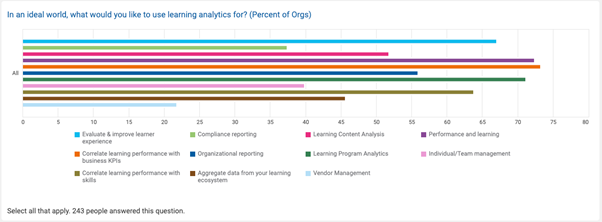
When asked about their ideal-world analytics application, however, performance-related analytics were significantly more popular—representing three out of five of the most common responses.
When we compared current uses of learning analytics to ideal ones:
- ‘Performance and learning’ rose from 44% of respondents to 73% (+29%)
- ‘Correlate learning performance with business KPIs’ rose from 39% of respondents to 73% (+34%)
- ‘Correlate learning performance with skills’ rose from 28% of respondents to 64% (+36%)
Put another way, approximately a third of respondents are not currently using analytics to measure performance but would like to.
If you want to measure learning’s impact on job performance and business KPIs, you must design learning with specific performance improvements and business impacts in mind. If you don’t develop programmes to deliver a particular change in performance and practice, it becomes difficult to measure the impact of the training.
You also need to start collecting data about job performance alongside L&D data in a learning analytics platform. Otherwise, you won’t have any concrete evidence to show what’s working (and what’s not).
Learning Analytics: An Industry in Motion
Learning analytics are critical for helping organisations measure L&D’s impact on business outcomes. After all, if organisations take the time to invest in learning initiatives, shouldn’t they want to ensure those initiatives are worth the investment? It echoes the message the data told in the CLO report that the C-Suite desires a shift to tangible reporting on impact.
We’ve come a long way from when ‘learning analytics’ was a rare term. But when it comes to measuring learning’s impact, we’re still faced with challenges—such as budget, competing priorities, and lack of stakeholder buy-in.
David Ells 
Managing Director, Watershed
)
)
)
)
)